.jpg)
Key characteristics of the rising wedge pattern
The rising wedge pattern is bedrock for technical analysis. Let’s take a closer look into its key characteristics.
https://www.bapital.com/technical-analysis/chart-patterns-list/rising-wedge
Shape and structure
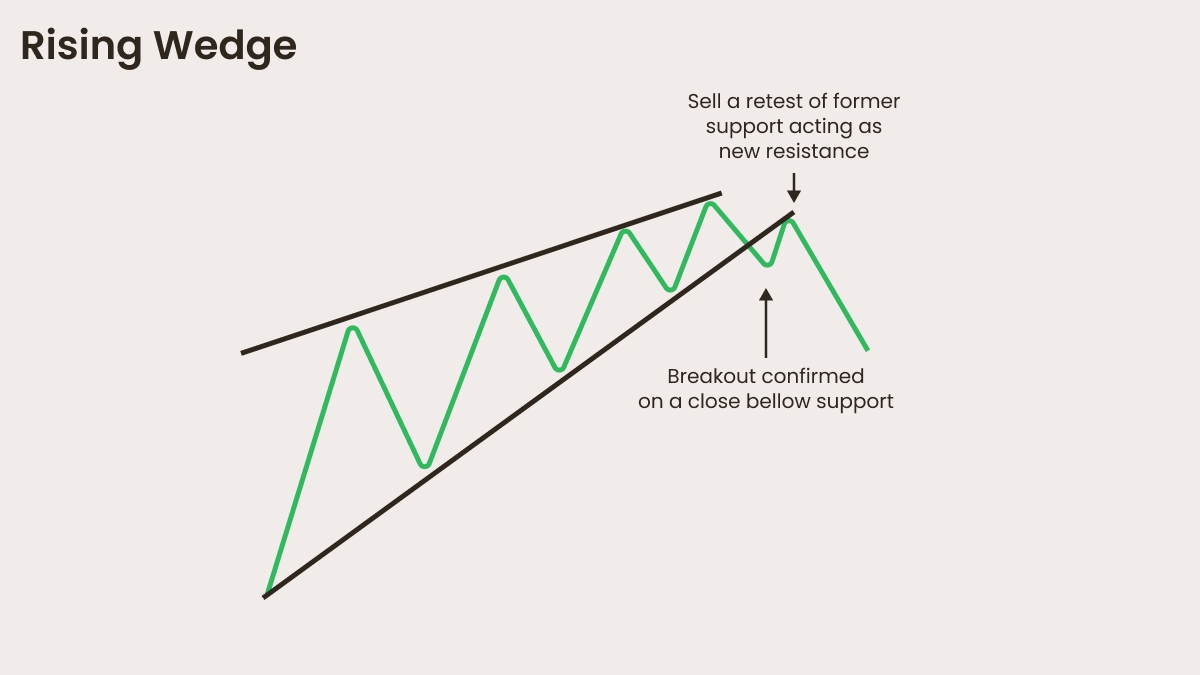
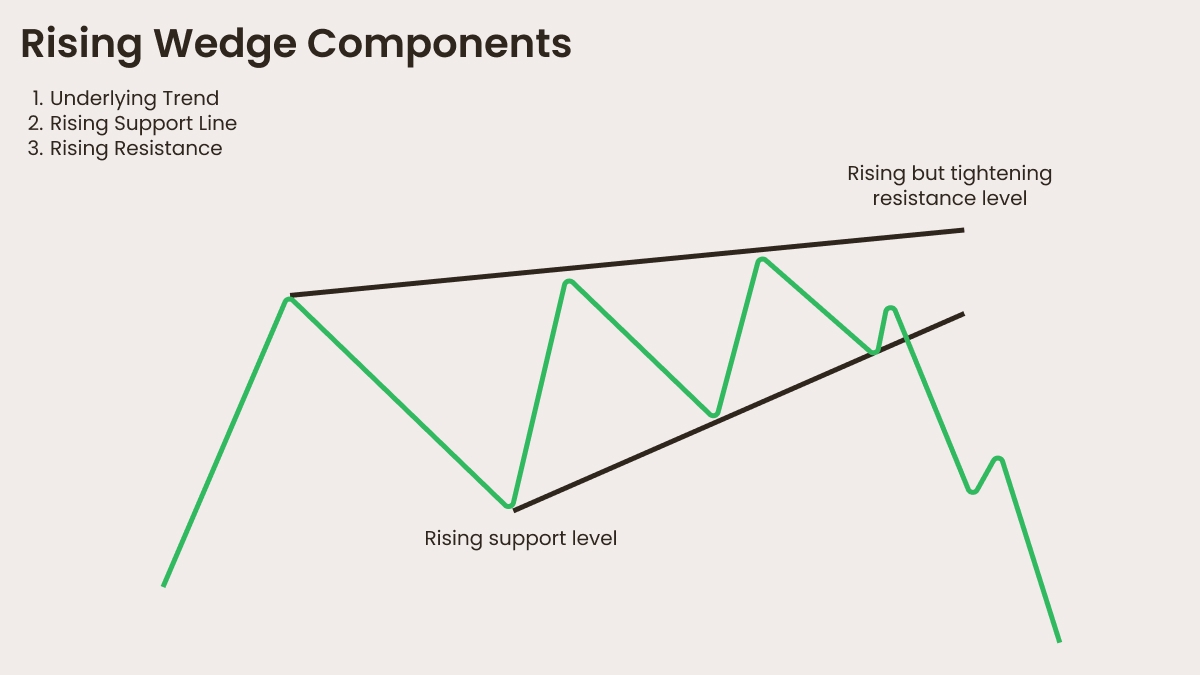
It forms when price movement starts to narrow, creating two upward-sloping trend lines that converge over time, signals that the price range is contracting. The lower trendline represents rising support, while the upper trendline acts as resistance. Note that the slope of the support line is steeper than the resistance line, showing a slowdown in upward momentum.
Volume behavior
This contraction of price action indicates an imbalance in market sentiment: buying pressure is starting to diminish and selling forces begin to take over. A breakout below the support trendline is usually accompanied by a surge in volume, which confirms the bearish move.
Breakout direction
The price is moving up within the wedge, which may seem confusing that the pattern is considered bearish. That’s because it often leads to a downside breakout. A breakout below the lower trendline suggests that sellers are taking control. So, regardless of the type (reversal or continuation), rising wedges are bearish.
Timeframe and occurrence
Rising wedges can form in any timeframe (from minutes to weeks). They often appear after an uptrend, acting as a reversal pattern — a warning for traders of a probable downward shift. However, they can also form within a downtrend: if prices start to fall after a short-term rebound, this signals a continuation pattern before further declines.
Confirming the pattern
A valid breakout usually happens when the price closes below the lower trendline with strong bearish momentum. You might want to look for additional confirmation, such as a moving average crossover, bearish candlestick formations, or RSI divergence.
Example of a rising wedge pattern
Imagine a stock is in an uptrend: it rises from $50 to $80 over a few weeks.
During this period the price moves within a tightening upward wedge, while the volume declines and buyers hesitate to buy at higher levels. The RSI indicator starts showing bearish divergence: the price makes higher highs, but the RSI makes lower highs. Eventually, the price breaks below the lower trendline at $75 and leads to a sharp decline to $65.
So what is the trading strategy when a rising wedge pattern occurs?
Trading strategy in a nutshell
Entry after a confirmed breakout below the support trendline.
Put a stop-loss order above the last swing high inside the wedge.
Your target is measured by the height of the wedge projected downward from the breakout point.
Master the rising wedge pattern and improve your market predictions. Trade with FBS.