Fundamental Analysis
The pair trades around 0.6550 with an intraday bullish bias, supported by strong Australian economic data.
Q2 GDP expanded by 0.6%, beating forecasts and improving compared to the start of the year, highlighting the resilience of the Australian economy.
Annual inflation rose to 2.8%, above expectations, reinforcing the Reserve Bank of Australia’s stance of not rushing into rate cuts.
Meanwhile, the US dollar is weakening amid growing expectations of a Federal Reserve rate cut, favoring AUD appreciation.
Technical Analysis – AUD/USD | H4

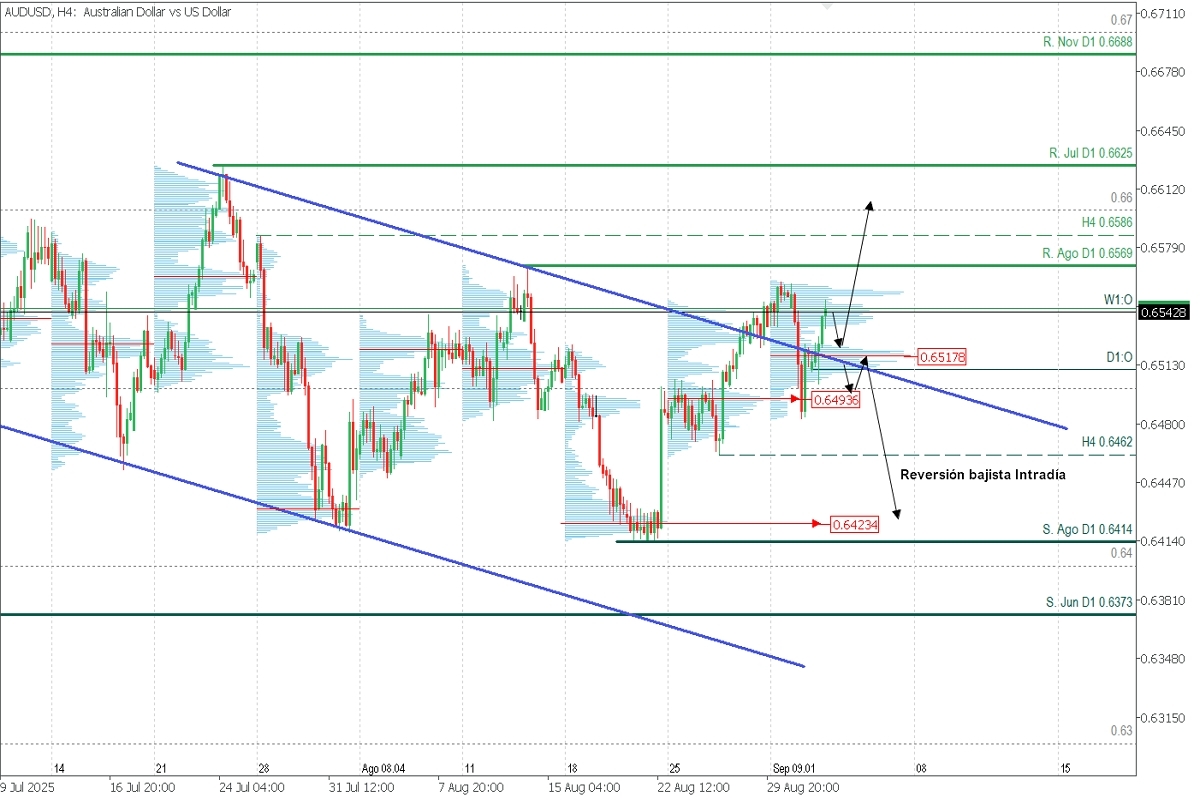
- Supply zones (sellers): 0.6554 | 0.6586 | 0.66
- Demand zones (buyers): 0.6517 | 0.6494 | 0.6423
On a broader scale, the pair has broken out of its bearish channel but remains under pressure below the July and August resistance levels.
Bullish Scenario: Key support at 0.6462. A break above selling volume nodes around 0.6542 could extend gains toward 0.6569, 0.6586 and 0.66, with potential to reach 0.6625 if momentum is strong.
Bearish Scenario: Triggered below 0.6539 with targets at 0.6517 and 0.65. A decisive drop below 0.6462 would confirm a bearish reversal.
Exhaustion/Reversal Pattern (PAR): Always wait for confirmation on M5 before entering trades.
POC (Point of Control): The price level with the highest volume concentration, acting as support or resistance depending on prior market direction.


