Key Context
- The U.S. Treasury General Account (TGA) is drawing down rapidly, having pumped $500B+ liquidity into the financial system since February 2025.
- TGA is expected to release another $100–$200B by the end of April and potentially much more if debt ceiling negotiations stretch into Q3.
- Analysts argue that Bitcoin could surge to $137K if this continues, signaling a broad increase in risk appetite.
Forex Impact Analysis
🔸 USD Outlook: Weaker Dollar Bias Ahead
- As liquidity injections expand, real yields may compress, diluting dollar value over time.
- If BTC rallies in response to higher liquidity, it reflects a "risk-on" shift, often leading to:
- If BTC is rising on Fed/Treasury liquidity, it's a signal that USD demand may cool, and high-beta FX could outperform. The dollar's next move may hinge less on rate hikes and more on how fast cash flows into the system.
BTCUSD – D1 Timeframe
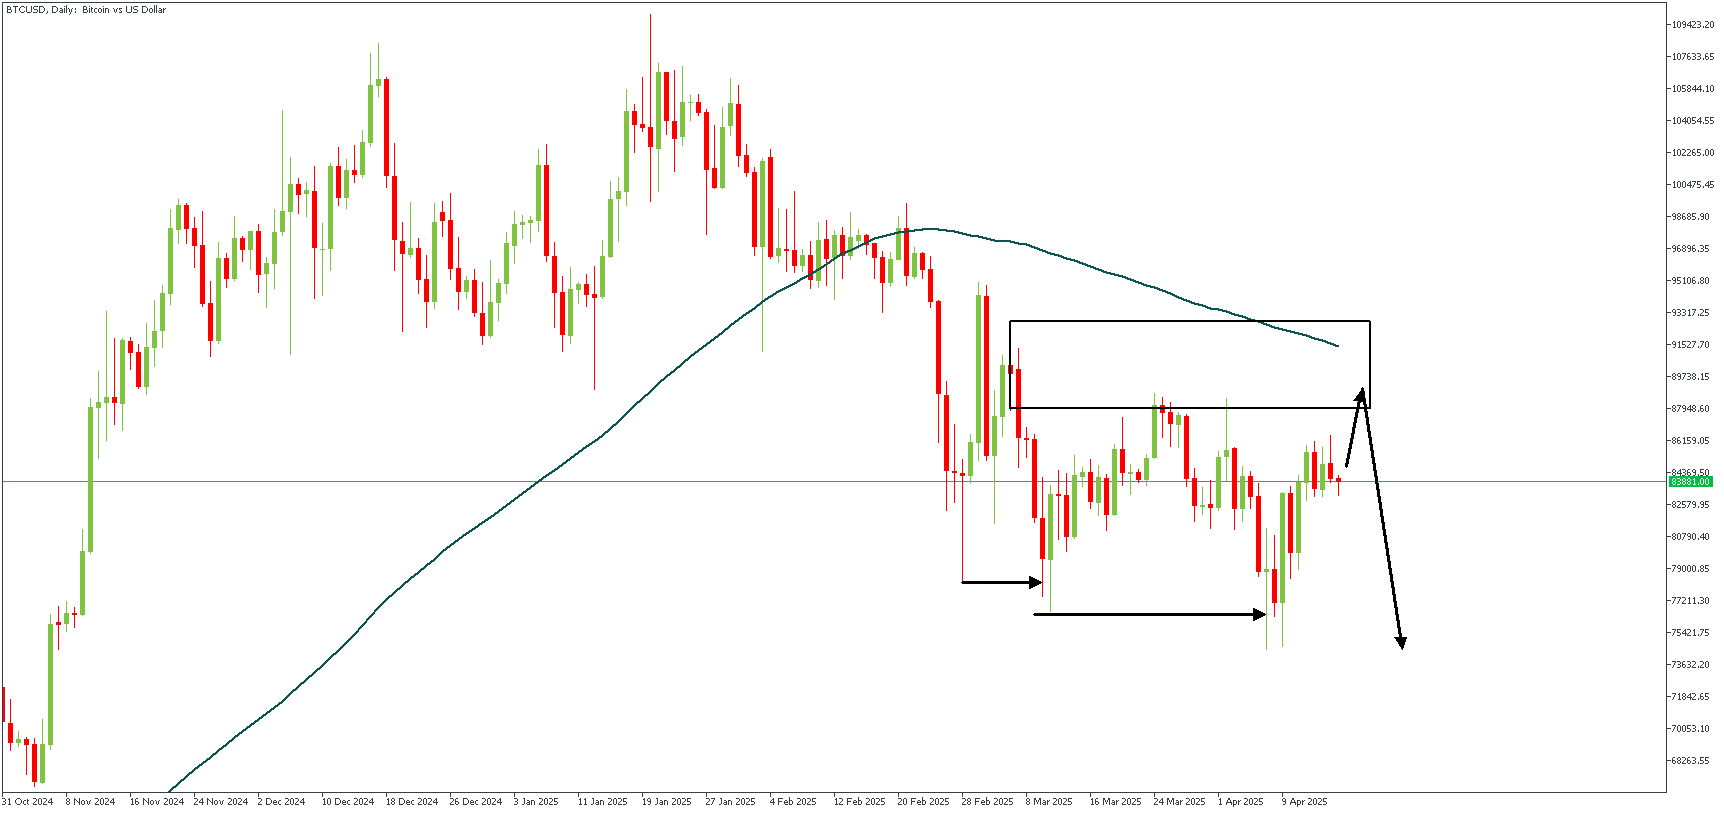
BTCUSD is currently trading below the 50-period moving average on the daily timeframe, signifying a bearish trend. A double bearish break of structure pattern has also been formed, with the price nearing the rally-base-drop supply zone. The confluence of the moving average resistance and the supply zone forms the basis for my bearish sentiment on the daily timeframe.
BTCUSD – H4 Timeframe
.png)
Regarding the 4-hour timeframe, the Fibonacci retracement tool is the added advantage. The liquidity above the double tops pattern will likely be swept so that price can reach the supply zone before a proper rejection occurs.
Analyst's Expectations:
Direction: Bearish
Target- 75860.69
Invalidation- 92921.48
CONCLUSION
You can access more trade ideas and prompt market updates on the telegram channel.


