Summary
- Current price: ~0.595
- Resistance Levels: 0.6005 (April 22 peak), 0.6050
- Support Levels: 0.5900, 0.5840
The pair's rebound has stalled near key resistance at 0.6000, a psychological and technical barrier. Failure to break above it could invite profit-taking, while a decisive push above 0.6005 opens room for momentum-driven rallies toward 0.6050. On the downside, 0.5900 remains critical support; a breakdown risks testing 0.5840 and 0.5800 quickly.
Fundamental Factors Affecting NZDUSD
- Policy Uncertainty After Orr's Resignation
- RBNZ Governor Adrian Orr's abrupt exit has unsettled markets, given his role in pushing rates to 5.5%, tipping NZ into a technical recession.
- Reports suggest Finance Minister Nicola Willis questioned RBNZ's hawkish stance and even the frequency of policy meetings, raising fears of political interference.
- Any erosion of central bank independence could severely undermine NZD credibility.
- Investor Sentiment & Risk Flows
- The NZD is a risk-sensitive, higher-yielding G10 currency.
- Uncertainty about the RBNZ's easing trajectory may dampen NZD buying interest.
- Conversely, a clear reaffirmation of the planned rate-cut path could stabilize sentiment.
- The USD may benefit from safe-haven inflows if investors view New Zealand's policy as politically compromised.
- Market Pricing
- The market has priced mainly in further rate cuts, so the risk lies in any shift in the cadence or scale of those cuts.
- A slower-than-expected easing cycle could support NZD in the near term but hurt growth expectations.
Key Takeaway for Traders
NZDUSD is highly sensitive to policy signals right now. With Governor Orr stepping down and political scrutiny rising, any hint of RBNZ losing autonomy could spark a sharp NZD selloff. Conversely, a smooth transition and reaffirming an easing path could restore confidence and push NZDUSD above the critical 0.6005 resistance.
NZDUSD – H4 Timeframe
.png)
When the momentum of price movement effectively breaks through both a trendline and the prevailing market structure, it often indicates a change in the direction or market sentiment. As seen on the 4-hour timeframe chart of NZDUSD, price has already completed the break of structure and the break above the trendline resistance, confirming the market sentiment as bullish.
NZDUSD – H2 Timeframe
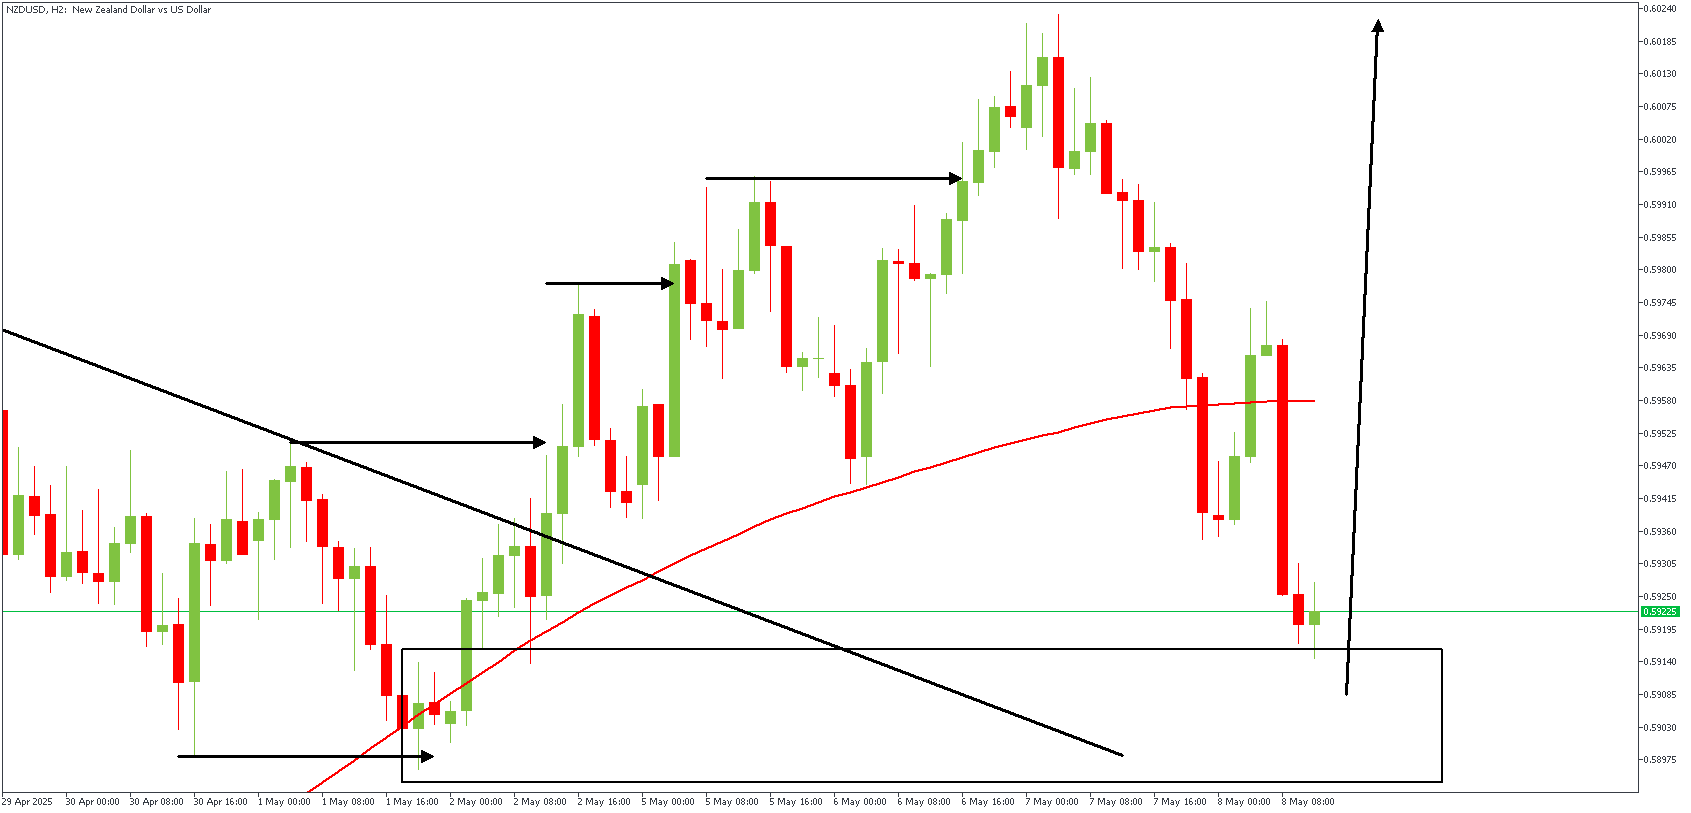
The 2-hour timeframe chart of NZDUSD shows an SBR pattern, where the highlighted demand area is supported by an inducement and the 80% Fibonacci retracement level. In essence, the SBR pattern confirms the bullish sentiment on the higher timeframe.
Analyst's Expectations:
Direction: Bullish
Target- 0.60232
Invalidation- 0.58878
CONCLUSION
You can access more trade ideas and prompt market updates on the Telegram channel.


