Massive Selloff – Friday, October 10
The S&P 500 recorded its steepest single-day drop since April, falling approximately 2.7%.
The decline was driven by renewed political risk following new U.S. tariff threats against China.
Investors moved rapidly into safe-haven assets such as Treasuries and gold, while volatility surged through a sharp rise in the VIX.
This session effectively served as a liquidity stress test, exposing how resilient the market structure remained after months of consistent gains.
Recovery Backed by Solid Fundamentals
1. Softer Political Tone
In the days following the selloff, statements from President Trump and Vice President Vance took on a more conciliatory tone toward China.
This easing of rhetoric helped restore risk appetite, calming markets and halting the wave of panic selling.
2. Technical Structure Still Intact
Before the downturn, both the S&P 500 and the Nasdaq had traded above their 50-day moving averages for over 100 consecutive sessions — one of the longest streaks in more than a decade.
That technical strength provided a cushion that limited further downside.
Many traders interpreted the drop as a healthy correction within a broader bullish trend rather than the start of a reversal.
3. Liquidity Flows and Sector Rotation
Post-selloff flows shifted toward high-quality and defensive stocks.
The market continues to be supported by sustained demand for large-cap technology and AI-related equities.
Although no significant new institutional inflows have been identified, selective rotations and buybacks have underpinned the rebound.
4. Gold and Equities Rising in Tandem
The simultaneous strength of gold and the S&P 500 reflects abundant global liquidity.
Capital appears to be seeking partial protection without abandoning risk assets entirely.
Lower Treasury yields have eased financing pressures, supporting both equities and precious metals at the same time.
Risks to Monitor
- A renewed escalation of U.S.–China trade tensions could trigger fresh volatility.
- The market may face overbought conditions if the rebound continues without consolidation.
- A lack of sustained institutional inflows could limit upside momentum once short-term liquidity rotation fades.
Technical Analysis – US500 (H4 Chart)
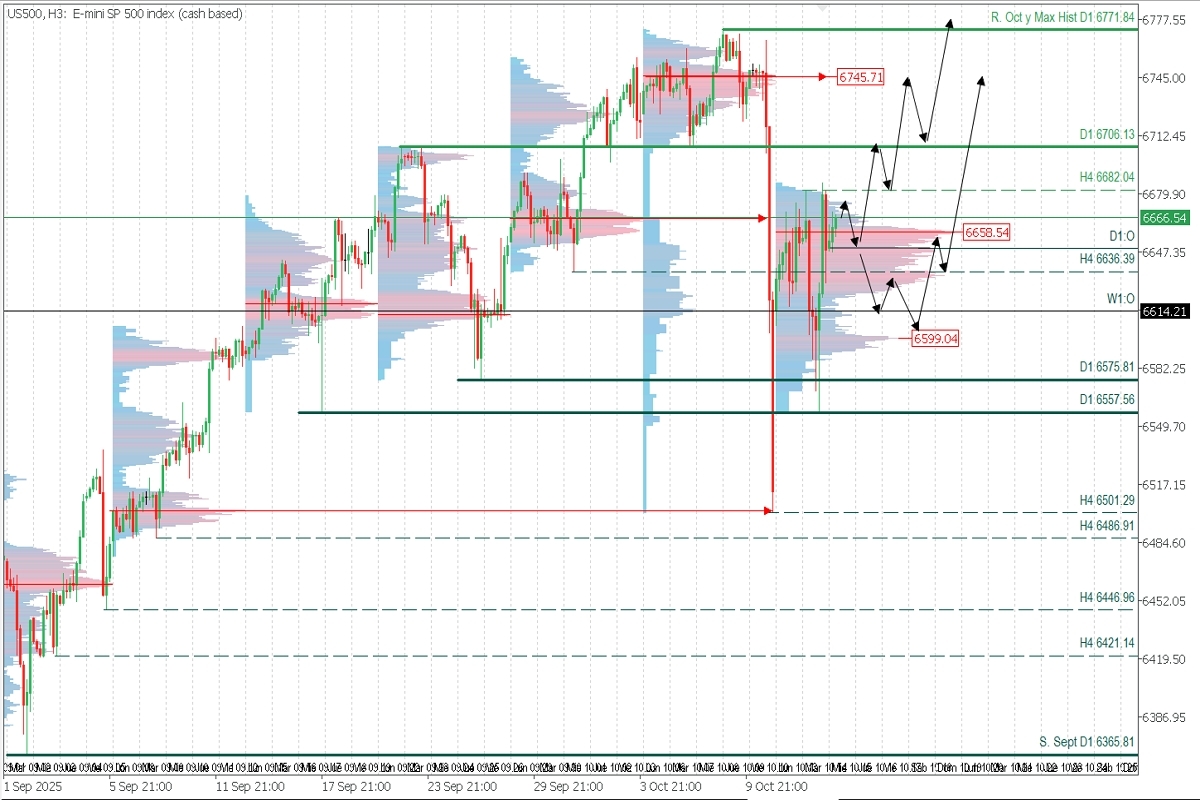
Current Situation
Following the sharp decline on Friday, the index broke through key intraday and daily supports, hinting at a potential bearish reversal if it falls below 6500.
By Tuesday, however, price action had retraced 50% of the opening gap and extended the correction above the broken H4 support at 6636.39, recovering nearly 70% of the drop.
The weekly Point of Control (POC) is now concentrated near 6658.54, with 6557.56 acting as the main support level for the correction.
Trading Outlook
Long positions remain favourable while price holds above the weekly open at 6614.21, and particularly above the POC at 6658.54.
Upside targets are set at 6706.13 and the previous supply zone around 6745.71.
A confirmed breakout above 6745.71, followed by a second retest, would open the way toward and beyond the all-time high at 6771.84, fully negating the bearish attempt.
Alternative Scenario
Price may still dip below 6658.54 toward 6636, 6614, or even the high-volume node near 6599.04 as part of a normal corrective phase.
These zones can be considered potential long entries before a later bullish continuation.
Conclusion
The S&P 500 is showing a technically coherent recovery supported by steady liquidity and a calmer political backdrop.The rebound aligns with a continuation of the broader uptrend, though it remains fragile until consistent institutional demand returns to confirm the move.
