Fundamental Analysis
U.S. equities traded lower amid persistent geopolitical risk, as escalating tensions between Israel and Iran boosted oil prices (~+3–3.5%) and weighed on cyclical sectors. Additionally, May retail sales fell more than expected (–0.9% vs –0.6% forecast), fueling concerns over weakening consumer demand. This combination of factors drove a risk-off sentiment, sending Treasury yields lower and dragging the S&P 500 down by 0.36% to 0.8% during the session.
Complementary Idea:
Despite the pullback, some analysts remain bullish. Morgan Stanley notes a rebound in upward earnings revisions (from –25% to –10%), which historically supports ~13% upside in the S&P 500 over the next 12 months, targeting ~6,500. Goldman Sachs also raised its short-term forecast to 6,100, citing easing tariff pressures.
Technical Analysis
US500 | H2 | Valid for 8–36 hours
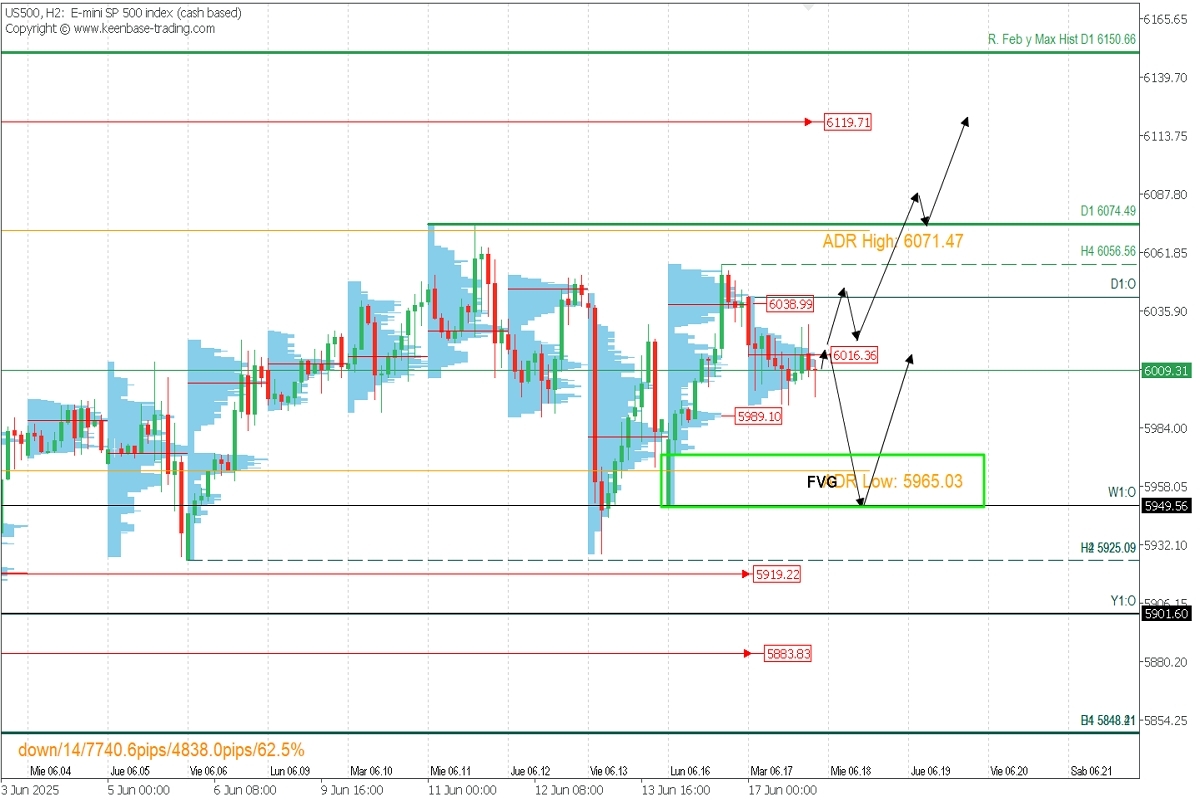
Supply Zones: 6038.99 | 6119.71
Demand Zones: 5989.10 | 5883.83
Price Action:
The index remains firm despite risk-off flows driven by geopolitics, which have slowed the recent climb. Prices are consolidating below last week’s resistance at 6074.49.
Bullish Continuation Scenario:
What initially appeared to be a bearish reversal last Friday is already showing signs of recovery. If the price decisively breaks and holds above today’s POC at 6016.36 (candle close with >50% body), this will turn into a new demand zone. A fresh rally could then target 6040, yesterday’s resistance at 6056.56, and 6074.49. Sustained momentum may push prices toward 6119.71 and attempt a breakout of the February high and current ATH at 6150.66.
Bearish Scenario:
If the price remains below 6016.36, it becomes a new supply zone, triggering potential intraday selloffs toward 5989 and the weekly open at 5949.56, which serves as both support and a potential demand zone due to a nearby volume gap (FVG).
📌 Technical Summary:
Bullish Bias:
Consider longs above 6040, with intraday targets at 6055, 6070, 6075, and swing targets at 6100, 6120, 6150.
Bearish Bias:
Shorts below 6000, aiming for 5989, 5965, 5949.56, where fresh buying opportunities may appear.
Exhaustion/Reversal Pattern (ERP):
Before entering any trade near key zones, always wait for confirmation via an ERP pattern on M5, as taught here 👉 https://t.me/spanishfbs/2258
POC Explained:
POC (Point of Control) is the level with the highest volume concentration. If the price dropped from that zone previously, it's a sell zone (resistance). If price rallied from it, it's a buy zone (support).

