Fundamental Analysis
WTI crude oil has experienced a significant decline in recent weeks, currently trading at $58.88 according to FBS. This downward trend is primarily driven by OPEC+'s decision to increase production by nearly one million barrels per day between April and June, raising concerns about a potential oversupply in the market. Additionally, weakening economic indicators from major economies like China, Europe, and the U.S. have dampened global demand for energy commodities.
However, on Monday, May 5, and Tuesday, May 6, WTI prices rebounded following an unexpected drawdown of 4.49 million barrels in U.S. crude inventories, as reported by the API. This inventory drop suggested stronger local demand. The rebound was further supported by a backwardation structure in the futures market, where near-term contracts are priced higher than longer-term ones, indicating immediate supply concerns. Despite this, on Wednesday, May 7, the market resumed its decline due to persistent worries about oversupply and weak demand. Currently, the market is at a crossroads, assessing whether to initiate a bullish correction or continue its bearish trajectory.
Technical Analysis
West Texas Crude | XTIUSD | H2 | Intraday and Weekly Swing Analysis
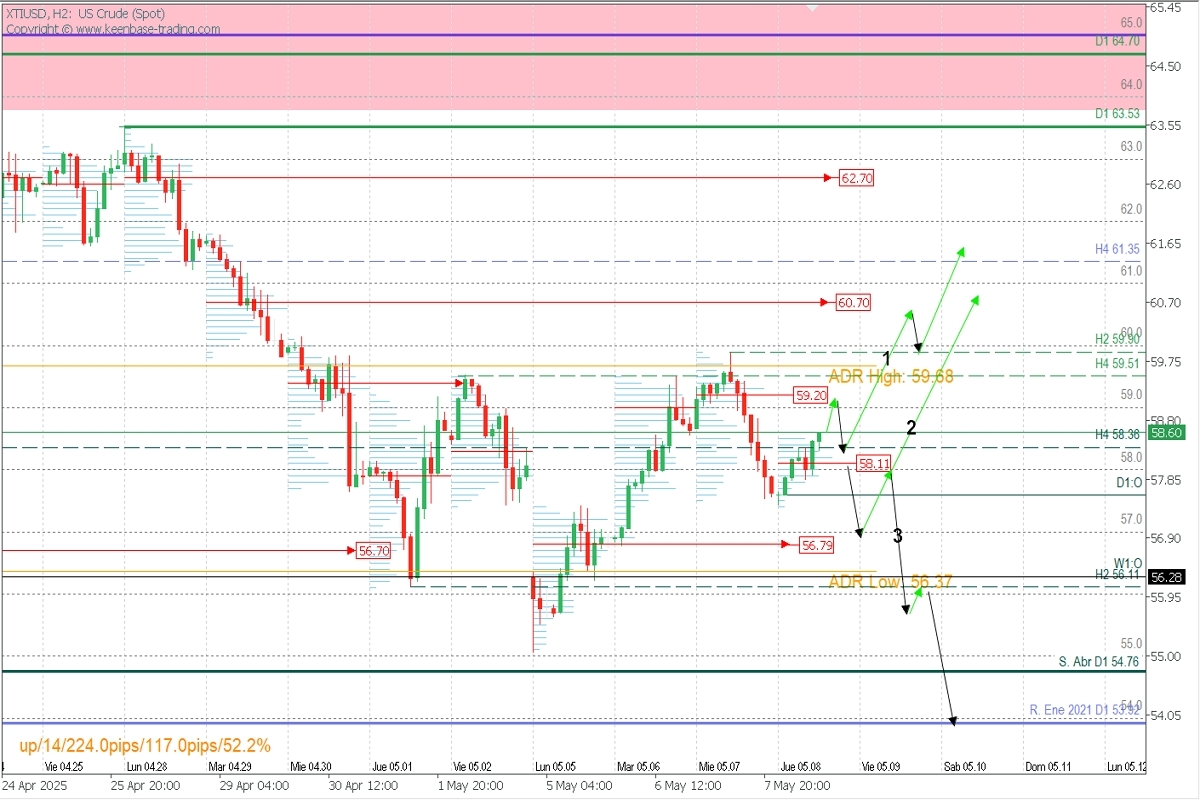
Supply Zones (Sell): 59.20 | 60.70 | 62.70
Demand Zones (Buy): 58.11 | 56.79 | 55.80
The price has been in a prolonged multi-month downtrend since the beginning of the year, suggesting a potential onset of a new corrective phase.
A bullish correction scenario will unfold upon confirmation of a breakout above the 59.51 resistance, or a bull trap, followed by a higher high. For this to occur, the price, which retraced 50% on Wednesday according to strict price action rules, must validate and break through yesterday's supply zone (seller's POC) at 59.20. The ensuing bearish reaction should remain limited by today's demand zone or POC at 58.11.
The subsequent upward impulse will aim to surpass 60.00 intraday and, after moderate pullbacks, target the next supply zones at 60.70, with potential expansion towards 61.35, 62.00, and 62.70 in the coming days or weeks.
However, the possibility of increased supply from OPEC+ members weighs on price recovery, implying that the anticipated rebound will likely require new market narratives; otherwise, prices may continue to decline, which OPEC+ aims to avoid.
We cannot rule out that if the price breaks below today's buyer's POC at 58.11, it may seek buying liquidity around the May 5 POC at 57.69 and reactivate the rebound with a head and shoulders pattern.
The bearish continuation scenario will be considered upon a reaction at 59.20, targeting 58.11 intraday. Only if this zone is broken should new sales be considered towards 57.79, whose breach will trigger a bearish extension towards 56.00, the April support at 54.76, and a potential extension towards 54.00 in a swing move.
Technical Summary
- Bullish Scenario: Buy above 58.11 (wait for a pullback with the formation and confirmation of an Exhaustion/Reversal Pattern (ERP)*) targeting 59.50, 60.00, 60.70, 61.00, and 62.00 in the coming days.
Bearish Scenario: Sell below 59.20 (after the formation and confirmation of an ERP*) targeting 58.11. Only a decisive break of this level will allow for extended or new sales targeting 57.00 and 56.80. If the price decisively breaks or after a second impulse this demand zone, consider new sales towards 56.30, 55.00, and 54.00 in an extended move over several days.
*Exhaustion/Reversal Pattern (ERP): Before entering any trade in the key zones indicated, always wait for the formation and confirmation of an ERP on M5, as taught here:
*Uncovered POC: POC = Point of Control: The level or zone where the highest volume concentration occurred. If previously, a downward movement originated from it, it is considered a sell zone and forms a resistance zone. Conversely, if an upward impulse originated from it, it is considered a buy zone, usually located at lows, thus forming support zones.
