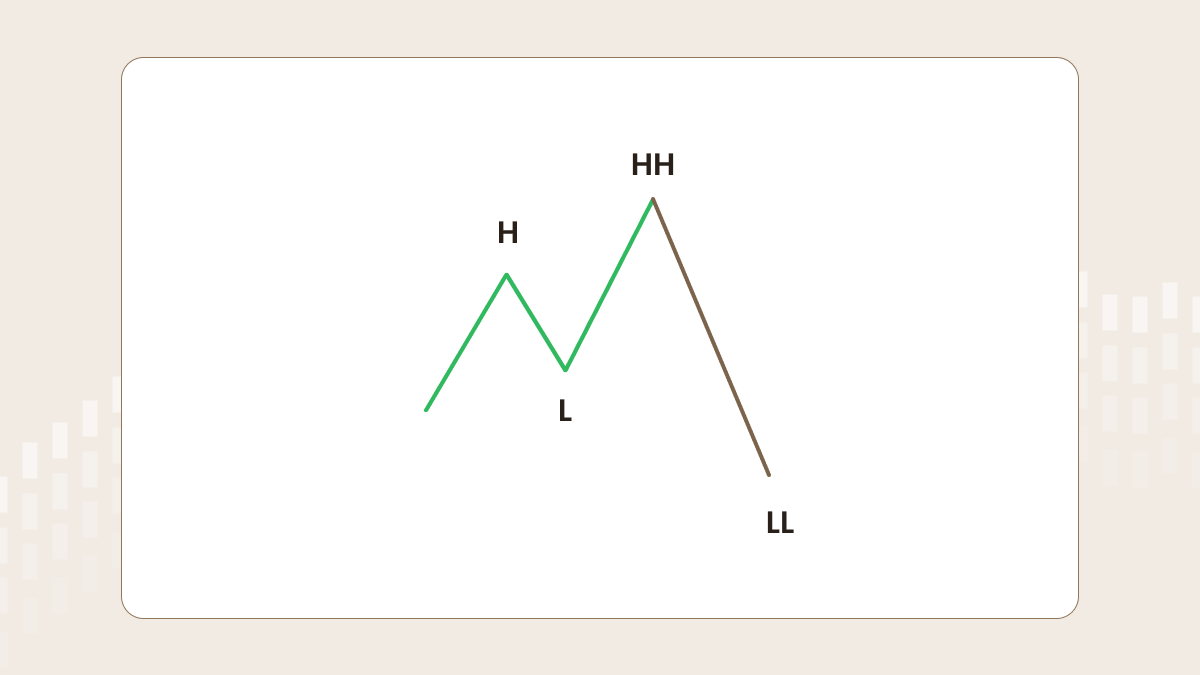
Uptrend
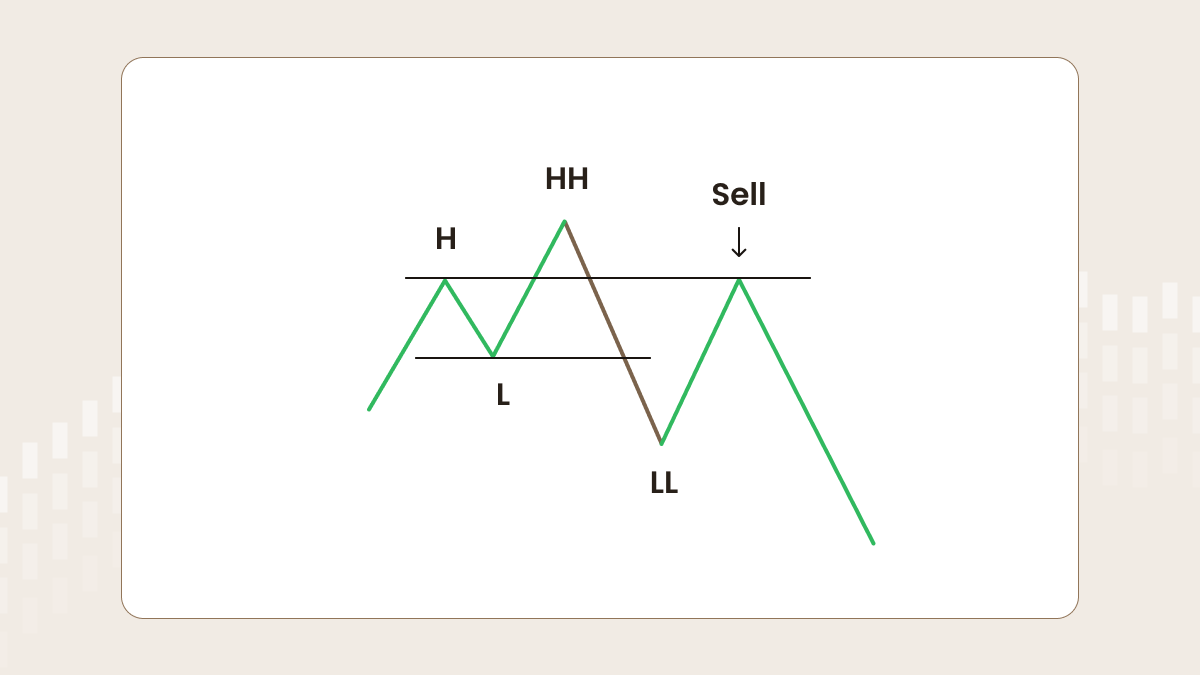
Let’s say there is an uptrend on the chart. The first high (H) is followed by the first low (L), which is followed by the second high (HH – higher high). After that, if the price drops out of the trend structure and forms a lower low (LL), a trader should be ready to sell when the price reaches a certain level, which we will discuss later.
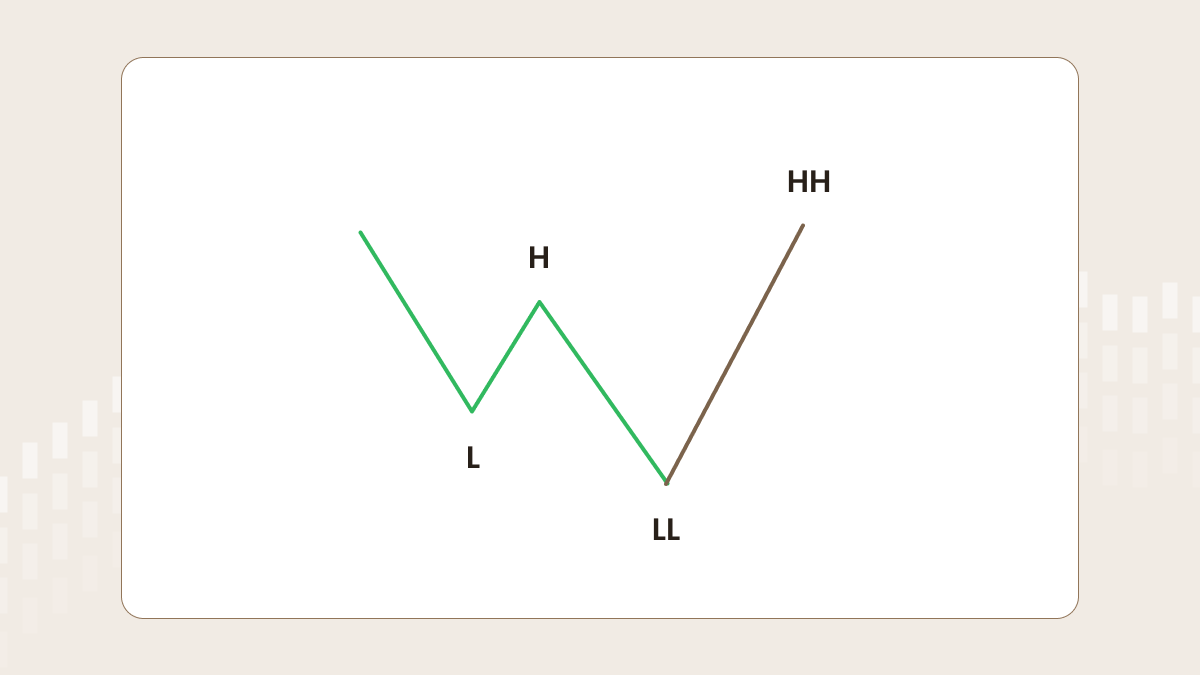
Downtrend
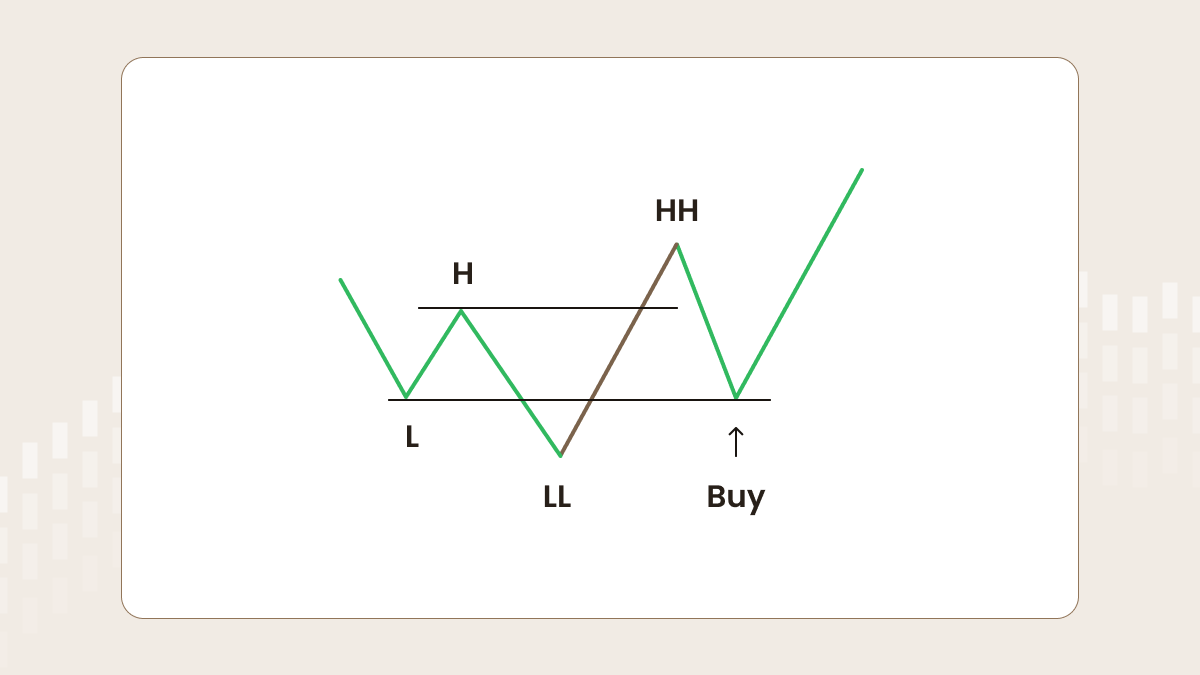
Let’s look at the opposite case: a downtrend. The first low (L) is followed by the first high (H), which is followed by the second low (LL). After that, if the price breaks the trend structure and forms a higher high, a trader should be ready to buy when the price reaches a certain level.
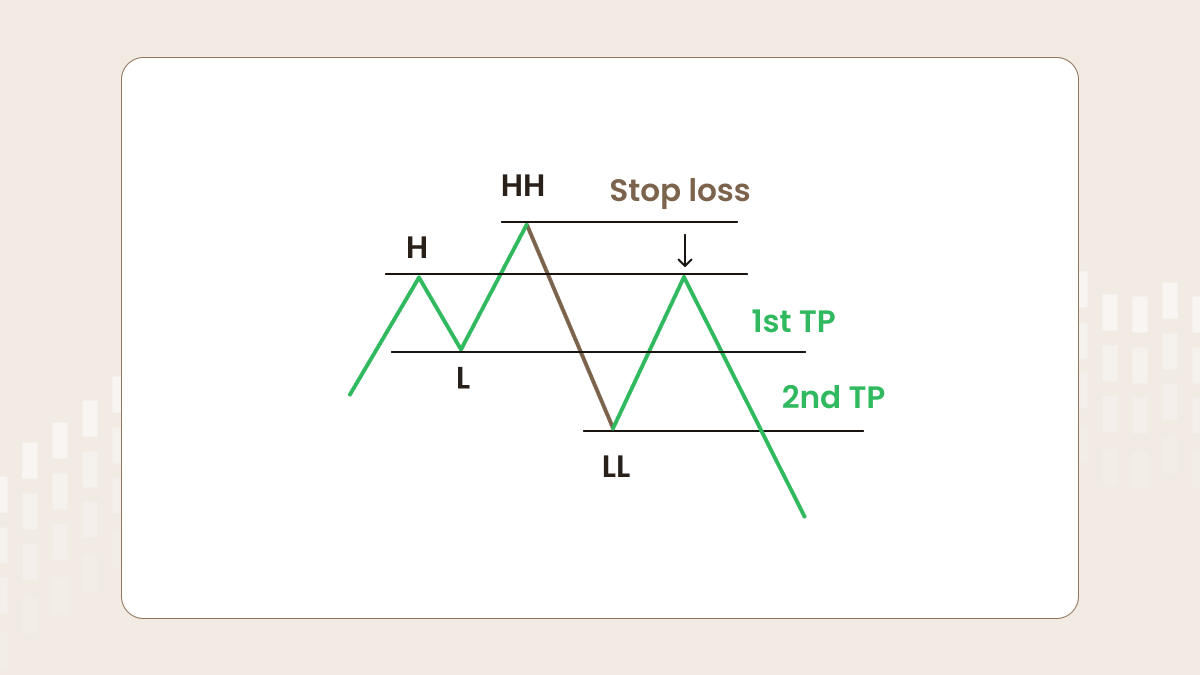
Entry rules to SELL
Let’s discuss where and how to open a sell order. The perfect moment for entry is the rollback to the first high (look at the picture below). This structure works as there are some so-called ‘big players’. To make a huge selling, they need an enormous number of buy orders to make their trades more profitable. The area between H and HH represents the zone of increased liquidity. Thus, there are many buyers as they believe in the further continuation of a trend.
The better way to enter is to use a pending order. First, you should wait for the formation of the lower low (LL). Second, you should place a sell limit at the level of the first high (H).
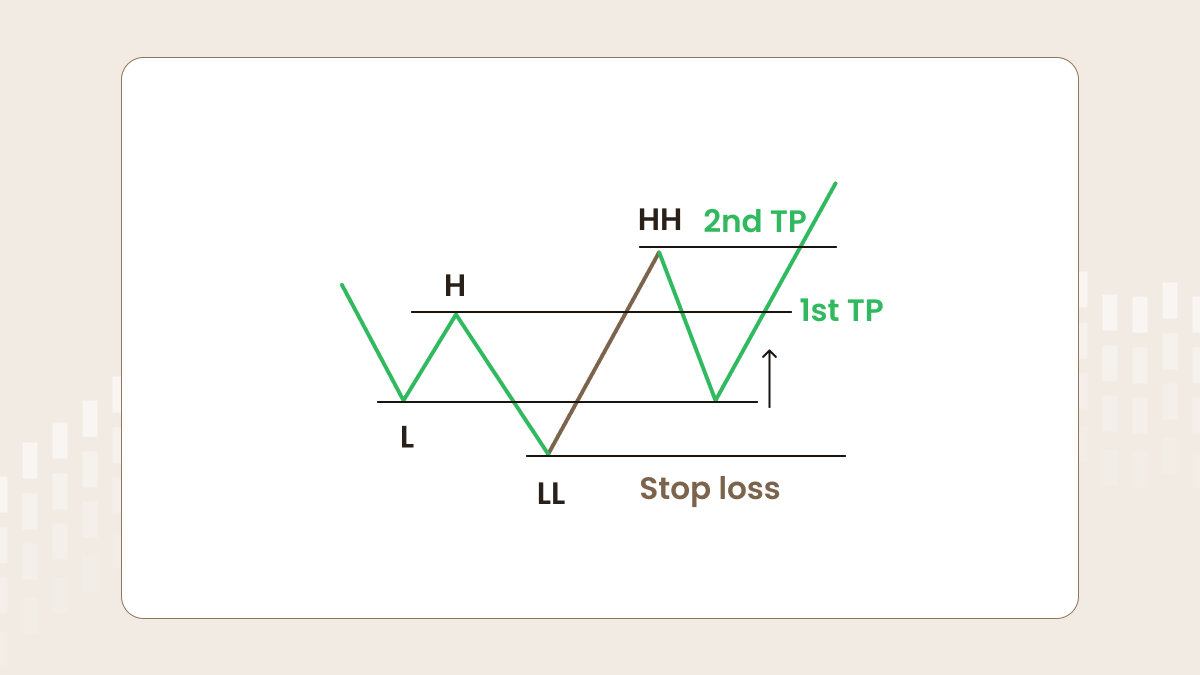
Entry rules to BUY
By the same logic, in the case of buying, the zone of increased liquidity is located between the first and second low (L and LL in the picture below). There are a lot of sellers who believe the downtrend will keep going. Some traders buy too early, some of them panic and close their orders, and most have stop-losses in this area. That’s why a big player sees this moment as a great opportunity to buy. Wait for the formation of the higher high (HH) and set a buy-limit at the level of the first low (L).
Minimize risks
Use stop-loss
Just to remind you, a stop-loss is an exit order, which is used to limit the amount of loss a trader may take on if the trade goes against him.